Tips 'n' Tricks
07 Oct Mastering the Data Dashboard: A Guide for Verified Creators on RedGIFs

As a verified creator, you have access to the Data Dashboard. This powerful tool is designed to assist you with building your content strategy. This resource offers a detailed view of your weekly metrics, which are key to fine-tuning your strategy on RedGIFs and driving your success.
We’ll walk you through the dashboard’s main sections and show you how to leverage its insights for maximum impact.
The Weekly Headlines section summarises your total content views, likes, profile views, and followers. This snapshot helps you monitor your overall performance and understand how your content resonates with your audience.

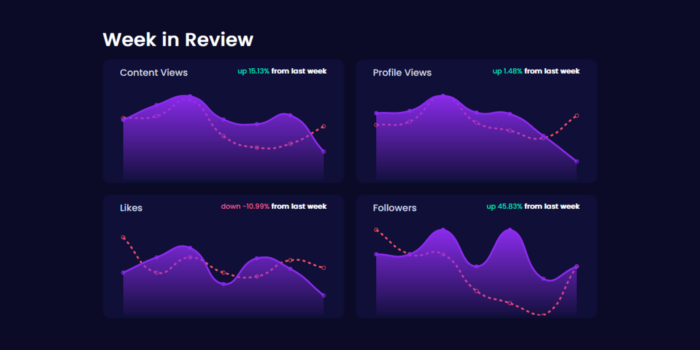
Understanding the trajectory of your content is crucial for long-term success, and the Week in Review charts make it easy to track your progress. These charts display week-over-week trends for each of the metrics mentioned in the Weekly Headlines.
By monitoring these trends, you can identify patterns in your audience’s behavior and adjust your content strategy accordingly.

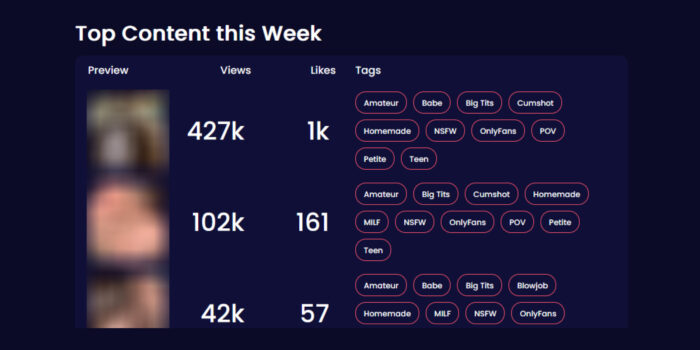
One of the most valuable sections of the Data Dashboard is the Top Content This Week. Here, you’ll find a detailed breakdown of your most successful posts, complete with the number of views, likes, and tags associated for each piece of content. By analyzing your top-performing content, you can replicate successful elements in future posts, experiment with similar themes, and refine your content strategy to boost engagement.

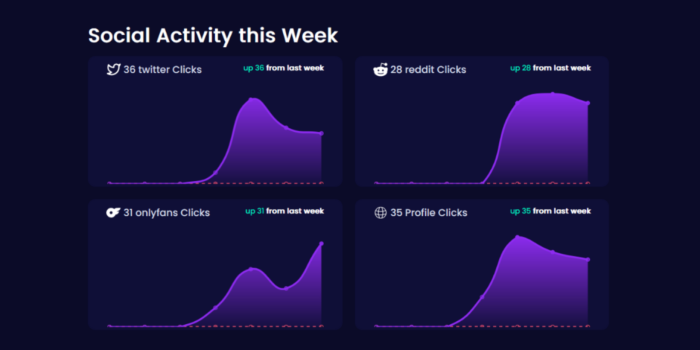
The Social Activity This Week section tracks click-through counts for the social links on your profile. Analyzing this data helps you optimize your profile and direct traffic to the platforms that matter most to you.

If you haven’t added your content to niches yet, our dashboard provides valuable insights into the impact! Content added to niches receives more views and helps Creators connect with the perfect audience. Check out our Niches, start adding your content, and watch your numbers soar!
The Data Dashboard isn’t just a tool for tracking your metrics—it’s a resource for strategic planning. By consistently reviewing your data and making informed decisions based on the insights you gain, you can increase your impact as a creator on RedGIFs.
Whether you’re optimizing your content strategy, monitoring audience engagement, increasing your revenue on paid platforms, or tracking the effectiveness of niches on increasing your views, the Data Dashboard is your key to sustained growth.
Take advantage of this resource, and watch your RedGIFs presence soar!